The 1976 CIE Chromaticity Diagram
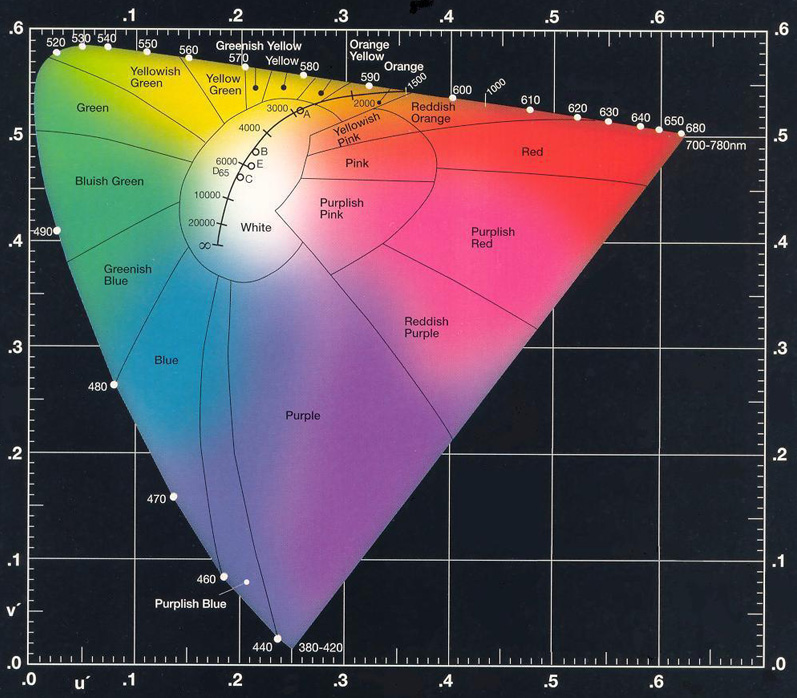
Image courtesy of Photo Research, Inc.
When the description "CIE Chromaticity Diagram" is used, it typically refers to the standard diagram established in 1931. Two revisions have been made since then - one in 1960 and one in 1976. All three contain the same information, just scaled differently. Conceptually, the big advantage attributed to the 1976 diagram is that the distance between points on the diagram is approximately proportional to the perceived color difference.
The CIE system characterizes colors by a luminance parameter Y and two color coordinates x and y which specify the point on the chromaticity diagram.
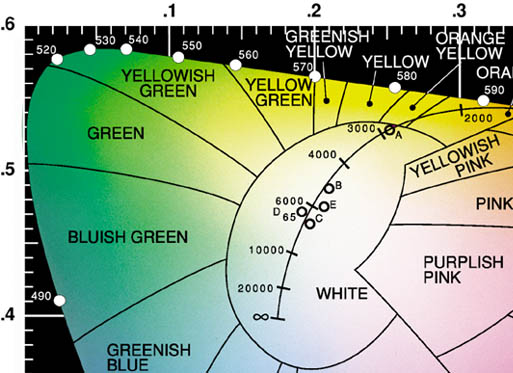
| Blackbody curve on the CIE Diagram |
References:
The Color Phenomena site gives the conversion relationships between the 1976 CIE standard and the previous CIE-1931 and CIE-1960 standards, which are still in use.
CIE concepts
Color measurement concepts
| HyperPhysics***** Light and Vision | R Nave |