Reverberation Time
Physics 4060: Acoustics Laboratory
The most important single parameter for the evaluation of auditorium acoustics is the reverberation time . Reverberation may be defined as the sum of the reflected sound energy from the surfaces of the enclosure. Hence in a perfect anechoic chamber there would be no reverberation at all since all sound energy is absorbed at its first interaction with the walls. An isolated point source, remote from any surfaces would produce no reverberation since there is no reflection; the inverse-square law applies. An auditorium produces a departure from the inverse-square law because the reflected sound adds to the direct sound at a given location. A certain amount of reverberation is highly desirable since it adds richness to the sound and prevents the loudness of the sound from dropping off so steeply as you move toward the back of the auditorium. However, excessive reverberation "muddies" the sound and makes speech garbled and unintelligible. Hence the need for a measurable parameter with which to evaluate the amount of reverberation: the reverberation time.
If you clap your hands in an empty auditorium, you hear the sound die away until it is no longer audible above the background sound level in the enclosure. In another auditorium which is more "live" you note that the sound takes longer to die away, while one in which the sound fades too quickly is said to be "dead". This experience gets at the basic idea of the reverberation time, but a precise quantitative definition is desirable since the time to die away to background depends on the loudness of the original sound and the background level. The stantard definition of reverberation time is the time required to drop 60 decibels below the original sound level. This is an arbitrary definition, but has some rationale in the fact that orchestral music is usually in the range 40 to 100 decibels and a typical auditorium background is about 40 decibels. Hence this definition of reverberation time is about the time required for the highest crescendo of the orchestra to die away to room background level. The desirable range of reverberation times for general purpose auditoriums is about 1.5 to 2.5 seconds. Longer reverberation times are sometimes desirable for music and somewhat shorter reverberation times are better if the auditorium is to be used for speech only.
The reverberation time can be measured by producing white noise in the enclosure at a level 60 dB above background, switching it off, and measuring the time it takes to drop back to background. The drawbacks to this method are that it takes a high power source and the noise produced is unpleasantly loud. Measuring the time required for a smaller intensity drop and extrapolating to the 60 dB time is the usual procedure. This requires some calculation and a mathematical model for the decay curve of the sound in the enclosure.
If a sound source of intensity I0 is switched off at time t=0, then the sound starts to die away and will be 60 dB down (or 10-6 I0) at a time t=T, one reverberation time later. If the sound field decay can be modeled by an exponential curve then

where T is the reverberation time (sometimes called RT60 as a mnemonic for its definition). To evaluate the scaling constant a , note that

Taking the natural logarithm of both sides gives

This evaluation will permit a calculation of the reverberation time T if any two intensities I0 and I are measured along with the time interval t between the two measurements. From equation (2) the relationship for T is

If a storage oscilloscope is adjusted for a slow sweep, the decay of the sound field will appear something like Figure 1. However, the voltage from the microphone is being displayed rather than intensity, and the intensity is proportional to the square of the voltage. In terms of the measured voltages, the reverberation time relationship from (3) becomes

This is the relationship which is to be used in the experiment to determine

Figure 1. Measuring voltages and time from the oscilloscope
the reverberation time of the room. It could then be compared with the approximate relationship

where V = room volume in cubic meters, S = surface area in square meters, and a = average absorption coefficient. The rough absorption coefficient obtained in this manner could help to evaluate the change which might be made in the reverberation time by changing the surfaces (carpet, curtains, etc. ). Absorption coefficients for standard building materials are available in tables.
Procedure
Connect the white noise generator to the audio amplifier so that white noise can be produced in the room. Choose a distance from the loudspeakers which could be considered to be and "ideal listener" location. Set up the sound level meter at that point and connect its output to the storage oscilloscope. Measure the background level in dB (20 kHz position) and produce white noise in the room at least 10 dB and preferrably 20-30 dB above background. Put the oscilloscope on single sweep, storage mode and set the sweep time slow enough that you can react to the sweep and switch off the sound once the trace is started. The faster the sweep, the better your time resolution, so some experimentation will be necessary.
With about four repetitions, take the data on voltage and time during the decay as indicated in Figure 1 and calculate the reverberation time for each. Average to get a final result. Make a rough measurement of the room dimensions and calculate an average absorption coefficient.
Reverberation Time as a Function of Frequency
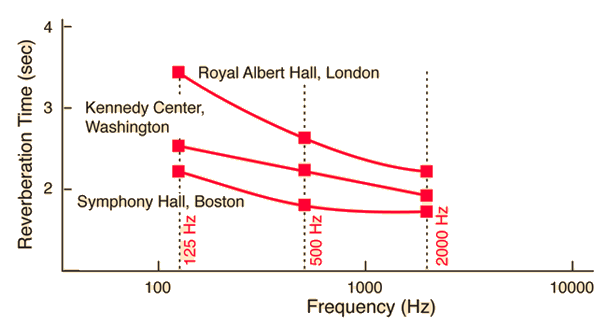
The reverberation time discussed above is an overall average reverberation time, including all sound frequencies. The variation of reverberation time with frequency is also important. In the auditoriums and opera halls which are judged to have the best acoustics, the reverberation time for low frequencies is considerably longer than that for high frequencies. A rule of thumb is that the reverberation time for lows is about 40% longer than that for highs in these enclosures. You can observe this effect by clapping your hands sharply in a quiet auditorium. The initial sound is a sharp sound containing many high frequencies, while the last sound heard as the sound dies away is a low frequency sound.
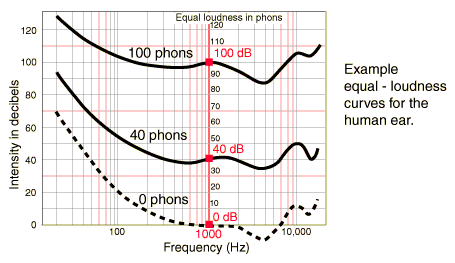
A longer reverberation time for low frequencies gives you an effective "bass boost" in the rear of the auditorium where the reverberant sound is a larger fraction of the total ambient sound. This need for a bass boost in the areas of the enclosure where the sound is softest is a characteristic of the human hearing response. As indicated in Figure 2, the equal loudness curve for human hearing is "flatter" at loud sound levels than it is at softer sound levels. The sensitivity of the ear to low frequencies drops off more rapidly than that for midrange frequencies as the sound intensity is decreased.

Figure 2. The change of the human hearing response curve with changing loudness.
A musical composition which is perceived to be well balanced at the front of the auditorium will be perceived to be deficient in bass at the rear of the auditorium unless some bass boost occurs. This is often explained by saying "High frequencies carry better than low frequencies." - but in terms of the sound transmission, quite the opposite is true. You have no doubt observed that the thunder from nearby lightning is a sharp crack, while distant thunder is a low rumble. Part of the physical reason is that high frequency sounds are absorbed by the air more efficiently than lows - hence more of the lows reach you over a long distance. This low rumble of distant thunder is also enhanced by the fact that low frequencies are more efficiently structure-borne through the earth, buildings, etc. Also, their longer wavelengths lead to more diffraction around buildings and other obstructions in their path. The situation in an auditorium differs in that none of the "distant thunder" effects really apply, and one can reasonably assume that all frequencies travel equally well. Air absorption is not a significant factor in most auditoriums, so the bass boost occurs because most building materials, particularly woods, absorb high frequencies more readily than low frequencies.
In summary, if the sound is soft it needs to have more bass because the ear discriminates against low frequencies more and more as the sound gets softer. This is shown by the comparison of the human hearing curves for loud and soft sounds in Figure 3. The rise in the low frequency end of the hearing curve for soft sounds means that more low frequency sound energy will be needed to achieve equal loudness. This undesirable bass discrimination of the ear is overcome if there is more low frequency reverberation than high in the auditorium. The needed bass boost is contributed by having a longer reverberation time for low frequencies.
Procedure
Pass the output of the white noise generator through the Pasco tunable filter to the audio amplifier. Use the "band pass" mode of the filter to transmit only a norrow band of frequencies. Start with 100 Hz and measure the reverberation time as described in the previous section. Repeat for 200, 400, 800, 1200, 1600, 2000, 4000 Hz and plot the reverberation time as a function of frequency.

Figure 3. A longer reverberation time for low frequencies gives a needed bass boost in the rear of an auditorium.